
Bacterial growth curve
- In higher organism growth refers as increase in size and volume of organism but in bacteria growth refers as increase in number.
- When fresh liquid medium is inoculated with a given number of bacteria and incubated for sufficient period of time, it gives a characteristic growth pattern of bacteria.
- If the bacterial population is measured periodically and log of number of viable bacteria is plotted in a graph against time, it gives a characteristic growth curve which is known as growth curve or growth cycle.
Population growth of bacteria:
- The growth is defined as an increase in number of microbial cell in a population which can be measured as an increased cell mass.
- Growth rate is the change in cell number or cell mass per unit time. So during cell division all the cellular constituent doubles.
- The pattern of population increase is referred to as exponential growth.
Generation time:
- The time interval for the formation of two daughter cell from one is called generation time or doubling time.
- Generation time vary widely among organism.
- Under optimal condition, generation time determines the rate of microbial growth.
- The growth can be quantitatively analyzed by the determination of generation time. Therefore, generation time is a unit to measure bacterial growth.
- Let suppose, No is the initial population of certain bacteria.
- The population of bacteria after 1 generation (N1)= 2 x No
- Similarly, after 2nd generation (N2) = 2 x 2 x No=2^2No
- After 3rd generation (N3)= 2^3 x No
- After ‘n’ generation (Nn)= 2^n x No
- Nn= 2^nNo— this equation can be expressed in terms of generation time
- No= initial population
- Nt= population after time ‘t’
- n= number of generation after time ‘t’
- Therefore, Nt= No x 2^n
- Taking log on both side
- Log Nt = log No + nlog2
- n= (logNt- logNo)/log2
- n= (logNt-logNo)/0.301. this is the required equation to calculate number of generation.
- The growth rate of bacterial culture can also be expressed as a factor of the reciprocal of doubling time.
- Mean growth rate constant (k): The rate of growth during the exponential phase in a batch culture can be expressed in terms of the mean growth rate constant(k).
- This is the number of generations per unit time, often expressed as the generations per hour.
- K = n/t = logNt –logNo/0.301t
- The mean generation time for population to double or mean doubling time (g), can now be calculated.
- If population doubling time t= g, then
- K= logNt-logNo/0.301g
- And Nt=2No
- k= log(2No)-logNo/0.301g
- K= log2+ logno-logNo/0.301g
- K=1/g
- Therefore,Generation time (g) = 1/k
Growth curve:
- The growth curve is hyperbolic due to exponential bacterial growth pattern.
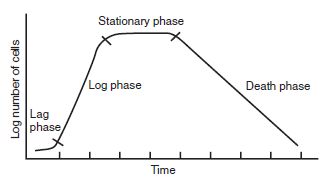
figure: Bacterial growth curve
The growth curve has following phases
- Lag phase
- Log phase or exponential phase
- Stationary phase
- Death phase or decline phase
1. Lag phase:
- When bacteria is inoculated into new fresh media, it do not divide immediately. Bacteria takes some time to adjust to the new environment. The time period in which bacteria is metabolically active but do not divide is called as lag phase.
- lag phase is characterized by the period during which there is no increase in number of cell.
- Size of bacteria increase continuously so the bacteria have largest size at the end of lag phase.
- In this phase, microorganism tries to adopt in new environment. It is the phase of adjustment necessary for the synthesis of enzymes and co-enzymes for physiological activities.
- Time is required for adjustment in physical environment around each cell.
- Duration of lag phase varies according to conditions and species of bacteria.
- If the culture organism is taken from old culture, the duration will be longer but if the culture is fresh, duration is short.
- Similarly if the culture media is different from the previous culture then duration is long because bacteria takes some more time to adjust in the new media.
- At the end of lag phase, bacteria become fully prepared for cell division.
2. Log phase or exponential phase:
- During this phase bacteria divides continuously at constant rate and the number of bacteria increase exponentially.
- In this phase all bacteria are in their rapid stage of cell division and show balanced growth.
- Due to rapid cell division, bacteria have smallest size in this phase.
- Bacterial population is nearly uniform in terms of their metabolic activities, chemical composition of cell and other physiological characteristics.
- Biochemical and physiological characteristics are commonly used for identification of bacteria are manifested during log phase of growth.
- Generation time of bacteria is usually determined during log phase. However it is not same for all bacteria in culture.
- Generation time is shortest during log phase and is strongly dependent upon growth factors present in the medium.
- This phase lasts for several hour depending on the type of organism, conditions of growth and density of organism.
3. Stationary phase:
- The bacteria growth reaches a state during which there is no net increase in bacterial population. This is called as stationary phase.
- In this phase a constant bacterial population is maintained by balance between cell division and cell death.
- In some bacteria, complete cessation of cell division occurs hence there is no net increase or decrease in number of bacteria.
- Stationary phase is induced by- increased bacterial cell density, depletion of nutrition in media and accumulation of toxic secondary metabolic wastes.
- Production of antibiotics such as Penicillin, streptomycin etc and enzymes by certain bacteria occur during stationary phase of their growth.
- In endospore forming bacteria, sporulation occur as the bacteria enter stationary phase.
4. Death phase or decline phase:
- In this phase, number of bacteria decrease continuously and exponentially.
- During this phase, total count of bacteria may remain constant but the viable count decreases.
- It is just inverse of log phase. But the death rate is slower than growth rate.
- Death phase is brought about by various reasons, such as depletion of nutrition and accumulation of toxic wastes.
- Not all bacteria die at same rate, some die faster and some are more resistant and remain viable for longer time. Eg. Spore forming bacteria.